In the following you may find sonification examples that were
developed in the project QCD-audio.
Code and sound examples or demo
videos can be found at the respective pages.
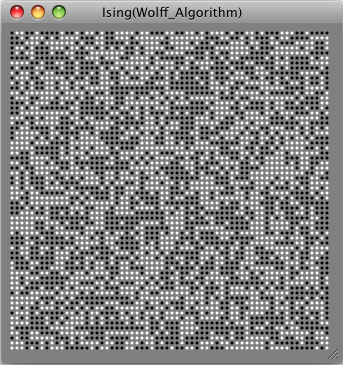  |
Ising audification
|
This sonification consists of an audification of the Ising model, or a sine wave modulated with the audified signal. The quality of the noise (homogenous vs. `unstable' / temporally structured) gives information on the temperature. The sonification falls silent for lower temperatures than the critical one.
|
 |
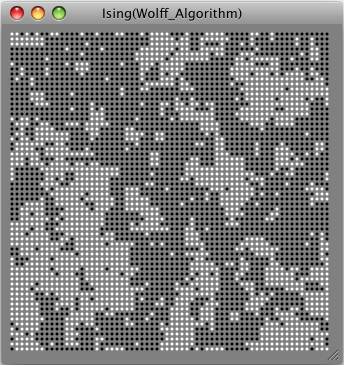
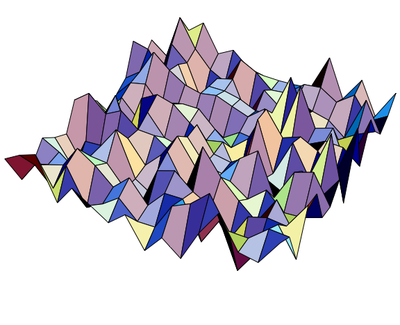
Ising grain cloud
|
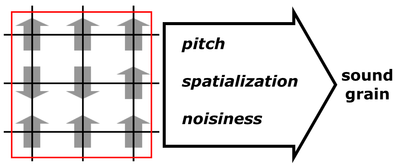
For a 3d Ising model evolving in real-time, a granular parameter
mapping sonification has been developed. A characteristic ‘texture’ is perceived as
a whole gestalt rather than as individual sound events.
|
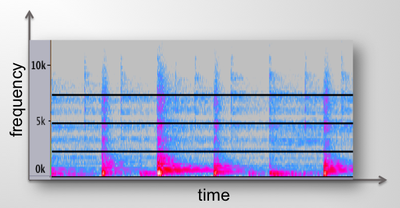 |
Ising gestalts |
The emergence of clusters at all scales at the critical temperature is opposed to the emergence of gestalts in our perception in this sonification. The approach demands more pre-processing than the
previous ones but is interesting for its metaphoric content. |
|
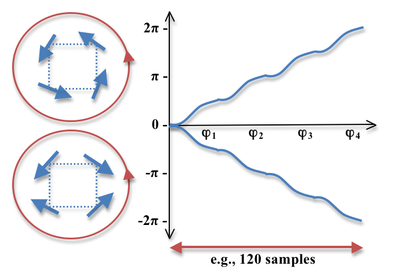
XY spin quartets |
The XY spin model exhibits topological structures: vortices and anti-vortices. The sonification uses only the raw data, but makes these structures audible, while laminar fields fall silent. The method is phase modulation, while the phase is determined by the spin values and distorted. |
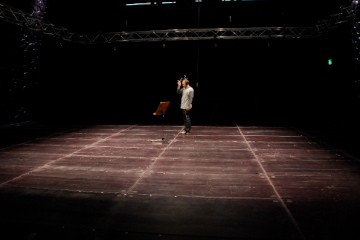 |
QED data listening space |
In the
sonification of QED model data we created a possibility to search for
local structures – the ‘data listening space’. The goal for the
installation was to create an aesthetically interesting listening
experience, that would enable the search for yet unknown structures. |
 |
Lattice QCD - Topological objects |
In two sonification approaches, data of the topological charge density are used as excitor (using the audification of a neighborhood of lattice sites and excite a range of frequencies) or resonator (using the sites as frequencies and excite them with white noise). A GUI facilitates the navigation through 4d. |
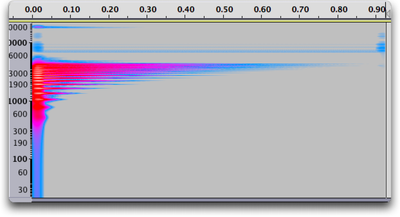 |
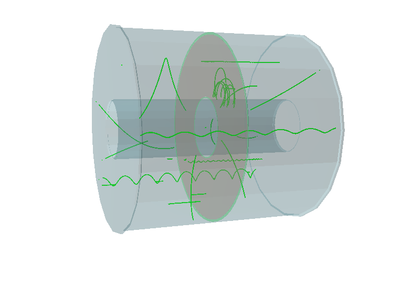
QCD waveguides |
Data from the Polyakov loop center symmetries show clusters, which percolate or not depending on the temperature. These clusters are regarded as `caves' that are excited by noise or an impulse. The resulting typical resonances give information on the form of the clusters. The sonification is model-based using a 3d digital waveguide mesh.
|
 |
Sonic TPC |
Data for this example stem from simulations of the Time Projection
Chamber (TPC) of the ALICE project at CERN. Based on the fact that ‘electrons’ hit the wires of the TPC with a certain charge, the wires
are taken as being analogous to strings, which are hit and
resonate with their basic frequency depending on their length. Grouping of tracks happens automatically.
|
 Previous:
Sonic TPC
Previous:
Sonic TPC

